Over the last couple of years Instagram, Facebook and many other social media have gotten rid of the chronological order in their post feed. While frustrating at first, this decision encouraged one part of social media that I like most of all: your content can be seen, discovered and rated not only by your friends and followers, but also by many other new people. To make your content discoverable you can use features such as hashtags, geolocations, tagging other people and so on.
In this article I will show you how to choose hashtags for your posts using machine learning to make it searchable for as many people interested in similar posts as possible. To solve this problem I will try to separate a dataset of Instagram hashtags from different users by their categories, so we can always have a good selection of hashtags on our hands. Ideally we will end up with a set of categories specific enough to fit your particular post, for example, about minimalistic architecture photography in Morocco or skydiving in New Zealand.
Perfect tag
In order to choose effective hashtags you have to balance two things.
First, your tags should not be overused, because otherwise your may easily get lost in millions of other posts. For example, hashtags such as #travel with 380m posts and #photooftheday with 644m at the moment are simply too popular making it quite hard to compete for the top places
Second, your tags must be popular enough in their category; there must be people who watch and update them with new posts daily. Let’s say, our lowest boundary for tag popularity will be 100k posts and the highest will be 10m. Those numbers are purely objective: I got them from my friends who are active Instagram users. The data may be not perfect, but it’s good enough for the first iteration.
In addition to all that numeric criteria, your tag must be related to your post and your post category, simply because users want to discover related content.
To keep it short, our perfect tag must:
• Be specific enough
• Have between 100k and 10m posts
• Belong to some group(s)
Our Goal
We are going to implement a categorization system, that will take tags like #building, #skyscaper, #architecturelovers and #architectureporn and put them in a category that we will later call Architecture, or put tags like #pizza, #pasta and #italy in another category that can be called Italian Food.
To accomplish this, we are going to to collect a large number of Instagram posts, extract tags from them, and divide those tags into categories. You may ask, where are we going to find a list of the categories? Here’s the beauty of machine learning algorithms: we don’t know right now and that’s fine! However, using a few techniques and algorithms, we can separate a huge number of tags into small groups.
That’s is how Unsupervised Learning works.
In machine learning there are two huge areas: supervised learning and unsupervised learning. The main goal of supervised machine learning is to determine if new data belongs to one of the already known groups, while unsupervised learning separates data into new categories, that were unknown before.
We will be using one of the most popular unsupervised machine learning algorithms — k-means.
Dataset
Our dataset consist of sets of hashtags, one for each instagram post. A single post may contain from 0 to 30 hashtags.
Here’s the distribution of tags in my dataset:
From this data, we can already make some quick assumptions. The two most popular numbers of hashtags are 1 and 30. It means that there are two broad categories of users: the first category assigns one meaningfull tag without spending lots of time on choosing more popular tags, and the other milks the hashtag machine for every possible opportunity :)
Posts without any tags are excluded from this dataset because they don’t provide anything for our task.
We don’t need any other information from posts except their tags: we don’t care about the author, location or number of likes. Our input data will be a list of arrays of tags, where each line represents one single post:
. . .
{artofvisual,instamoment,spain,photo,andalucia,instalike,igersspain}
{artofvisual,photos,nature,andalucia,instamoment,pic,spain,seville}
{picture,exposure,instalike,photoftheday,igers,spain,picoftheday}
{instamoment,picoftheday,photoftheday,picture,exploreeverything,igers}
{christmas,photoftheday,picoftheday,moment,pic,igers}
{ramennoodles,ramen,vegan,veganfood,whatveganseat,berlin,japanese,weekend}
{summer,frozenyogurt,oreo,mango,blueberry}
{photography,see,love,pic,mountains,view,picture,mood,dream,day,nature,pictureoftheday}
{autumn,tofu,instadaily,whatveganseat,lunch,vegan,pumpkin}
{hamburger,manhattan,fries,vegan,downtown,vacation,nyc}
{naturewalk,zipline,archery,sunset,cycling,hiking,kenya}
{sunsetlover,sunset,lovephotography,mobilephotography,sunsetsky,mobileclick,visionofpictures}
{flowers,shadow,simplicity,spring,minimalism,home,nature,sunny,weekend,tulips,morning,still,mood}
. . .
Measuring tf-idf for tags
We are going to place our posts into a multi-dimensional space, where each dimension represents one hashtag. It will be a very sparse space, because each post contains maximum of 30 tags, which means there will be 30 non-zero coordinate values, while all other coordinates, a couple of thousand of them, will be zero.
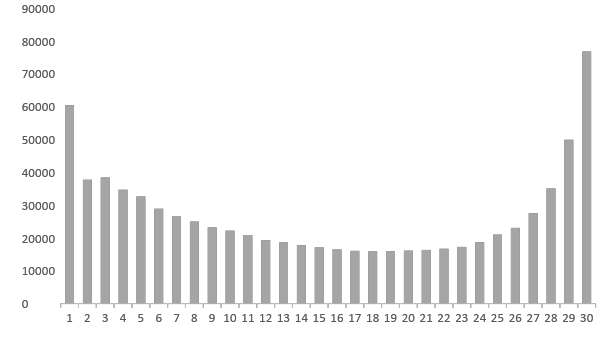
At this point, let’s do the whole process on a small sample dataset of 6 posts about Italian food and architecture:
0: {italy,food}
1: {food,italy}
2: {food}
3: {italy,architecture}
4: {architecture,italy}
5: {architecture, }
As you can see, this dataset has 3 unique hashtags: #italy, #food, and #architecture. That means we are going to be dealing with a 3-dimensional space.
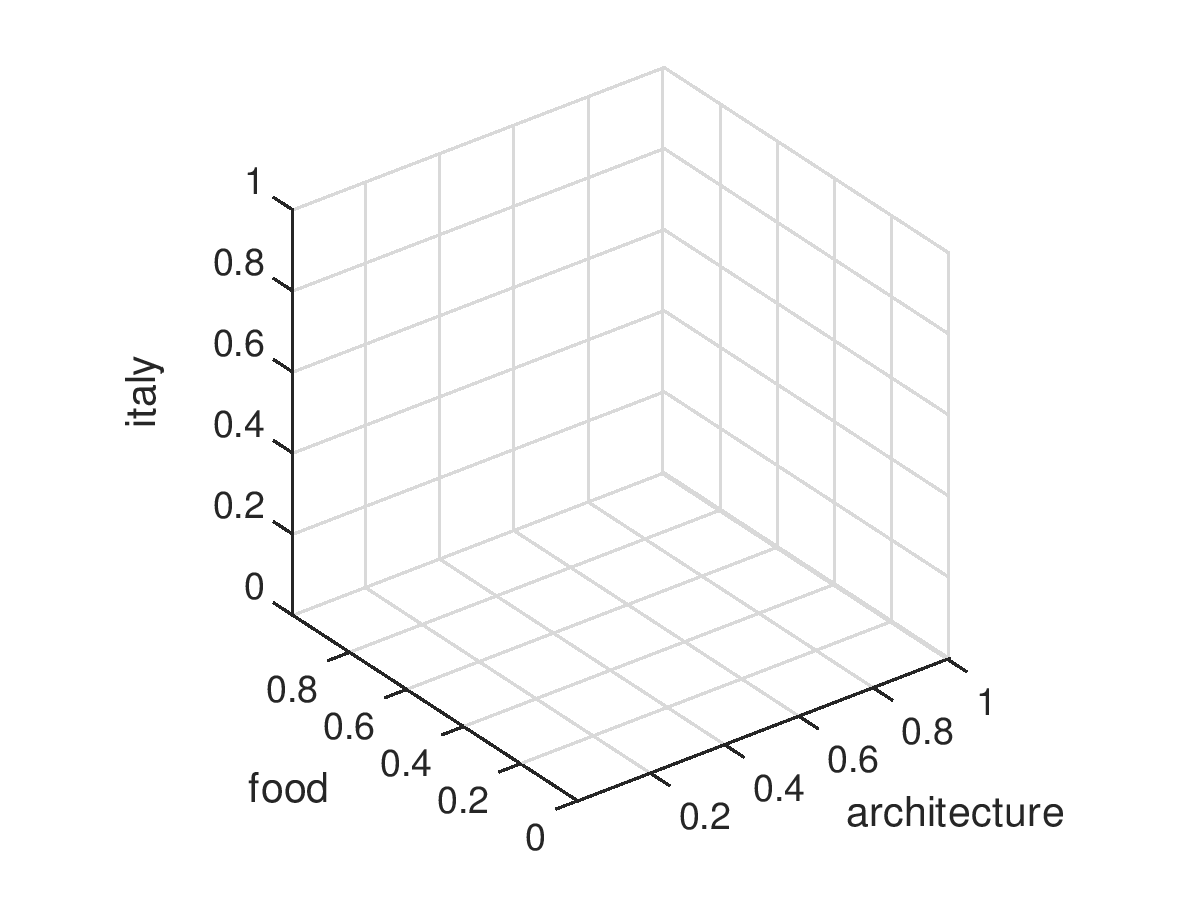
Now we need to put our posts into this 3-D tag space. We will calculate dimension values for every post using td-idf metric. This metric shows how important a word is in a document, in our case it measures the impact of a single tag for a post. It means that tags with very low or very high frequency will be assigned a lower rank.
vectorizer = TfidfVectorizer()
posts_coordinates = vectorizer.fit_transform(posts)
print(posts_coordinates)
| 0 | 1 | 2 | 3 | 4 | 5 | |
|---|---|---|---|---|---|---|
| architecture | 0 | 0 | 0 | 0.75 | 0.75 | 1.0 |
| food | 0.75 | 0.75 | 1.0 | 0 | 0 | 0 |
| italy | 0.65 | 0.65 | 0 | 0.65 | 0.65 | 0 |
Posts 0 and 1 contain exactly the same set of tags, so they have exactly the same coordinates and they are placed in the same position in our tag space. Same goes for posts 3 and 4; the order of tags doesn’t matter.
This will be our data for following clustering with k-means.
Applying K-Means
K-Means is one of the most popular clustering algorithms and it’s pretty simple. The only decision you have to make is the number of clusters you want your data to be divided into — k number. The goal of this algorithm is to determine coordinates of k points, which will be the centers of mass for a cluster. Those points are also called centroids.
The algorithm has 3 steps:
- Initialize k cenrtoids with random coordinates
- Divide all training examples into k groups by choosing the nearest centroid
- Assign new centroid coordinates by calculating a center of mass for the groups from step 2
Steps 2 and 3 are repeated until the algorithm converges or reaches an optimal state. Results may depend a lot on randomly chosen initial centroid values, so calculcations can be run multiple times to get rid of random impact.
Let’s see how it works on the example.
- In this image the gray squares are training examples and the colored circles are initial centroids. All the centroids are initialized with random coordinates, the training examples are not clustered.

- Here all the training examples are assigned to the closest centroid and marked with the centroid’s color

- Now we need to calculate new centroids for the groups created in step 2. This is achieved by calculating centers of mass for each training example belonging to a group

- Clusterization by distance from newly created centroid is repeated and if we see that there are no more iterations required we can stop the algorithm and call this clusterization final

Now we are going to apply k-means clusterization to our dataset of posts about Italy. By looking at it, we can tell that there are 2 groups: food and architecture. So our k-parameter(the number of clusters we are going to divide our group into) will be 2.
KMEANS_CLUSTERS = 2
...
model = KMeans(
    n_clusters=KMEANS_CLUSTERS,
    init='k-means++',
    max_iter=5,
    n_init=1,
    verbose=True
)
groups = model.fit_predict(data)
groups is an array with the same size as the initial data array — 6. And it contains groups ids for entries in data in the same order:
post 0: 0
post 1: 0
post 2: 0
post 3: 1
post 4: 1
post 5: 1
Our dataset was successfully divided into two groups: 0 — “food” and 1 — “architecture”.
Extracting Tags For Categories
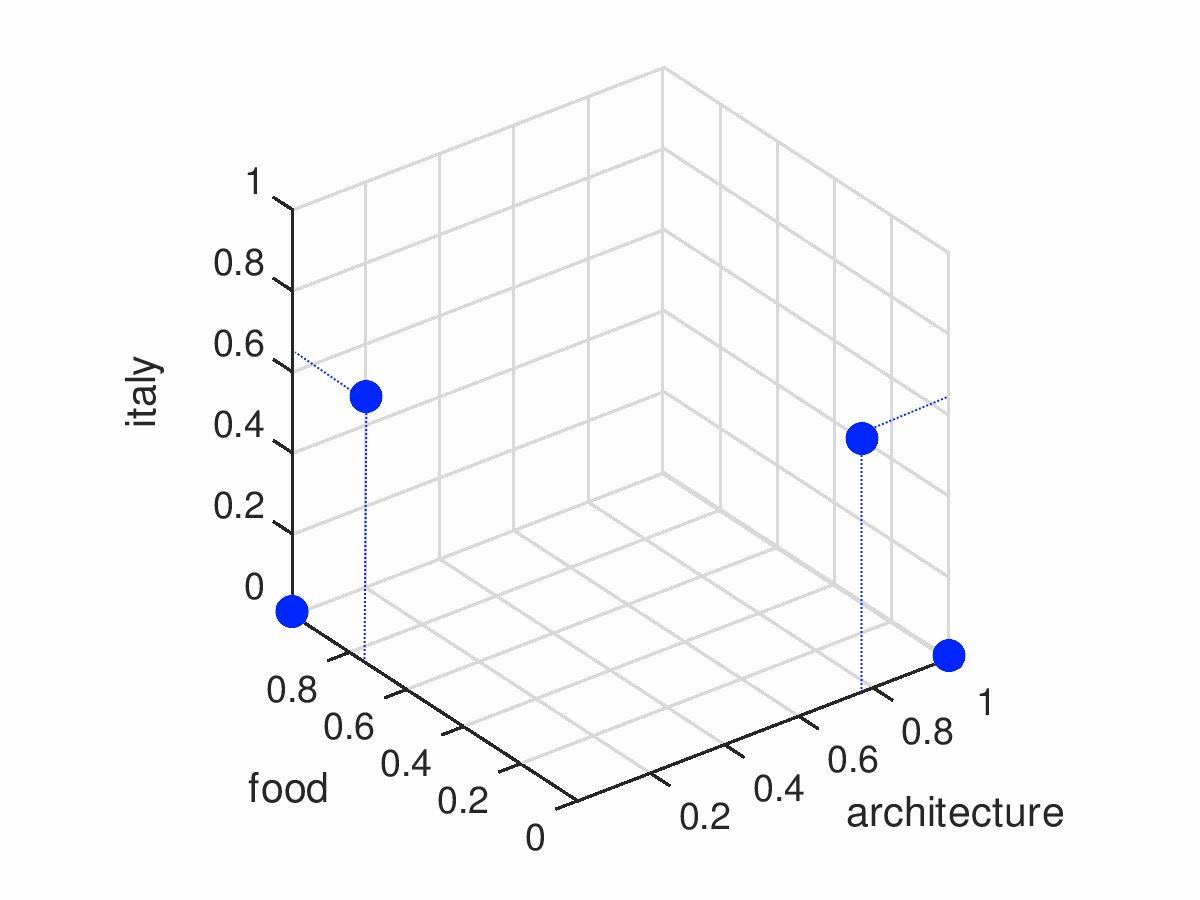
Lets see where the centroids are located.
centroids = model.cluster_centers_
centroids are represented by a 2x3 matrix where each row contains the coordinates of a centroid in 3-dimensional space. Let’s add them to our plot.
| architecture | food | italy | |
|---|---|---|---|
| 0 | 0 | 0.84 | 0.43 |
| 1 | 0.84 | 0 | 0.43 |
Our categories are located in the same 3-dimendional space as the posts from our training example. It means that each category has some numeric value that represents its relations to tags - coordinates. If we take absolute values of coordinates and sort them in ascending order - from highest to lowest - we can find tags with most impact on this particular category: it will be tags with lowest value, the closest to a category.
For instance, the most meaningful tag for our first centroid(on the right in the picture) is #architecture, and for the second centroid(on the left in the picture) it’s #food.
Imagine that we have many more tags, let’s say 10,000. We would not be interested in all 10,000 relations for each category, we would only want the most meaningful tags. So we will limit the top tags for each category by some number and only show those ones. This number will depend on how many clusters we choose.
Let’s get back to our example. We are going to limit the number of tags in each category by two and pick the two most meaningful tags.
TAGS_IN_CATEGORY = 2
...
ordered_centroids = model.cluster_centers_.argsort()[:, ::-1]
tags = vectorizer.get_feature_names()

for idx, centroids in enumerate(ordered_centroids):
    print("Centroid %s:" % idx)
    for centroid_tag in centroids[:TAGS_IN_CATEGORY]:
        print("#%s" % tags[centroid_tag])
This code separeates our tags into two categories:
Centroid 0:
#architecture
#italy
Centroid 1:
#food
#italy
Here, tags in the category are ordered from the most relevant to the least. If we take some tags from the top of every category, we’ll get tags that can represent this category in a shorter way than listing all of them. Let’s call them leading tags. Like if we were to choose the one leading tag from our categories, we would get #architecture and #food.
Let’s try this approach using a bigger sample. Imagine we have a classifier that produces tag categories with 20 tags, and one of the categories looks like this:
#boat
#water
#sailing
#ocean
#lake
#ship
#river
#boatlife
#boats
#port
#island
#sail
#yacht
#vacation
#reflection
#sailboat
#fishing
#bateau
#relax
#boating
This group clearly combines tags related to boats and sailing. We can give it a human-readable name using its leading tags. Let’s say we want to have 3 leading tags, then they will be #boat, #water and #sailing. In the next step, we will concatenate these tags into a single name so it will look like boat_water_sailing.
While working on a large dataset, we will end up with a huge list of categories named like this one, or, for example, something like animal_animals_cat, goodmorning_coffee_morning or sushi_japanesefood_food. These human-readable names can help us quickly understand what this group is about and implement a groups catalogue, search or group suggestions.
Result
In this article we’ve explored a way of grouping Instagram tags from a set of Instagram posts into thematic categories.
You can find a working demo here: https://github.com/smyachenkov/k-means_tags_demo.
I left behind some topics, for example, choosing k-means parameters like number of categories and number of tags in a single category. I will cover those topics in my upcoming posts.
In conclusion, I want to say that exploring new content can be very fun, and some categories have a huge amount of awesome content. You can use this knowledge to find interesting new people, find your unique style, place your content into the right category or be inspired by something new.
Keep expressing yourself!