K-Means is a very common and powerful clusterization algorithm widely used in an unsupervised machine learning tasks for dividing data into categories. The only decision you have to make is the number of clusters you want your data to be divided into — k number.
Sometimes you already know how many categories you need to have. It depends a lot on the type of your problem, your data, and the problems you are solving. For example, if you want to divide the dataset of people’s measurements into t-shirt sizes, you already know that t-shirts are measured from XXS to XXL and you can say with confidence that you know how many categories your data will have.
But often we face another type of a problem — when you don’t know the number of categories and you want to find it. One example of this problem is categorization of social media hashtags. In my previous post, you can read more about it.
There are a lot of methods of finding optimal number of categories in a dataset, and I will focus on the 2 most popular for the K-Means algorithm: the Elbow and the Silhouette methods.
Dataset
I will test both methods on a small synthetic dataset of Instagram posts with 50 entries. It contains 50 entries with 8 groups of 5 posts from different categories plus 2 groups of 5 posts from mixed categories.
{camping, mothernature, hike, earth, rain, wildlife, landscapestyles, naturewalk, natureonly}
...
{streetview, streetphotographers, streetclassics, street_photo_club, streetphotographers}
...
{architecture, archilovers, architecture_hunter, architecturelovers, creative_architecture}
...
{ireland, dublin, guinness, instaireland, discoverireland}
...
{ocean, sand, ocean, water, waves, seaside, wave}
...
{portrait_shots, portrait_mood, portraitsociety, portraitvision, portraitoftheday, portraitmode}
...
{ireland, dublin, guinness, instaireland, discoverireland, camping, mothernature, hike, earth, rain}
...
{catsofinstagram, cat, cats, cats_of_instagram, catoftheday, petstagram, catsagram}
...
{minimal_perfection, minimalmood, minimalistic, minimalismo, minimal, minimalism_world}
...
{architecture, archilovers, creative_architecture, minimalmood, minimalistic, minimal}
Lets try it!
Elbow method
The general idea for both methods is to try different values for k number and measure some of its metrics. In the elbow method, it’s the sum of the squared distances of an object to the closest centroid.
Let’s measure how different the performance params will be for the number of categories from 1 to 20.
with open("posts.txt", encoding="utf-8") as inp:
    posts = inp.readlines()
vectorizer = TfidfVectorizer(use_idf=True)
posts_coordinates = vectorizer.fit_transform(posts)
print("Number of clusters / Inertia / Diff")
previous = 0
for clusters_amount in range(1, 21, step):
    model = KMeans(
        n_clusters=clusters_amount,
        init='k-means++',
        max_iter=10,
        n_init=5,
        verbose=False
    )
    model.fit_predict(posts_coordinates)
    inertia = model.inertia_
    diff = previous - inertia
    previous = inertia
    print("%s: %s %s" % (clusters_amount, inertia, "-" if clusters_amount == 1 else diff))
This script gives us the following data where Categories column is the number of categories, Inertia is the sum of squared distances to the closest centroid, and Diff is the difference between current and previous values of Inertia:
Categories  Inertia Diff
1           43,56   -
2           37,13   6,43
3           31,82   5,30
4           26,74   5,08
5           21,82   4,92
6           17,93   3,88
7           12,74   5,19
8           9,07    3,66
9           7,74    1,33
10          6,57    1,16
11          5,99    0,57
12          5,76    0,23
13          5,54    0,21
14          5,31    0,22
15          5,10    0,21
16          4,86    0,23
17          4,64    0,22
18          4,56    0,08
19          4,25    0,30
20          4,05    0,20
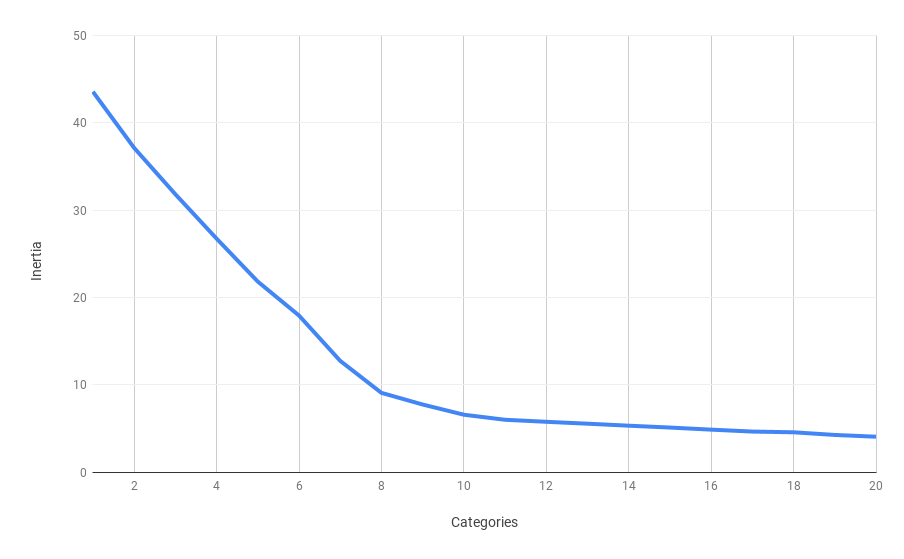
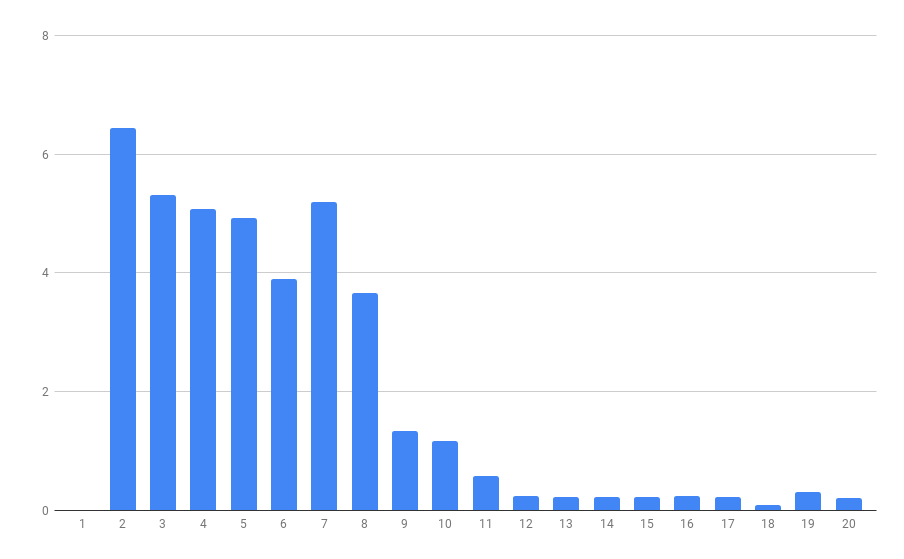
Here we can see that the Inertia parameter almost stops decreasing after the number of categories reaches 8. It’s even more clear on the second diagram, where the largest drop in speed has been achieved after the 8th category and every difference after that does not change much.
Now let’s try to confirm this number with a silhouette method.
Silhouette method
Silhouette metric has its values in a range from -1 to 1 and measures how far or close are points in clusters to points of another cluster. The higher the value — the farther points of clusters are from each other. And that’s what we want to achieve — more distinct clusters that do not intersect.
with open("posts.txt", encoding="utf-8") as inp:
    posts = inp.readlines()
vectorizer = TfidfVectorizer(use_idf=True)
posts_coordinates = vectorizer.fit_transform(posts)
print("Number of clusters / Silhouette score")
for clusters_amount in range(2, 21, step):
    model = KMeans(
        n_clusters=clusters_amount,
        init='k-means++',
        max_iter=10,
        n_init=5,
        verbose=False
    )
    categories = model.fit_predict(posts_coordinates)
    silhouette_avg = silhouette_score(posts_coordinates, categories)
    print("%s: %s" % (clusters_amount, silhouette_avg))
This script gives us the following data:
Categories Silhouette score
2          0,13
3          0,23
4          0,29
5          0,35
6          0,41
7          0,48
8          0,51
9          0,50
10         0,48
11         0,47
12         0,45
13         0,43
14         0,41
15         0,39
16         0,39
17         0,37
18         0,39
19         0,34
20         0,34
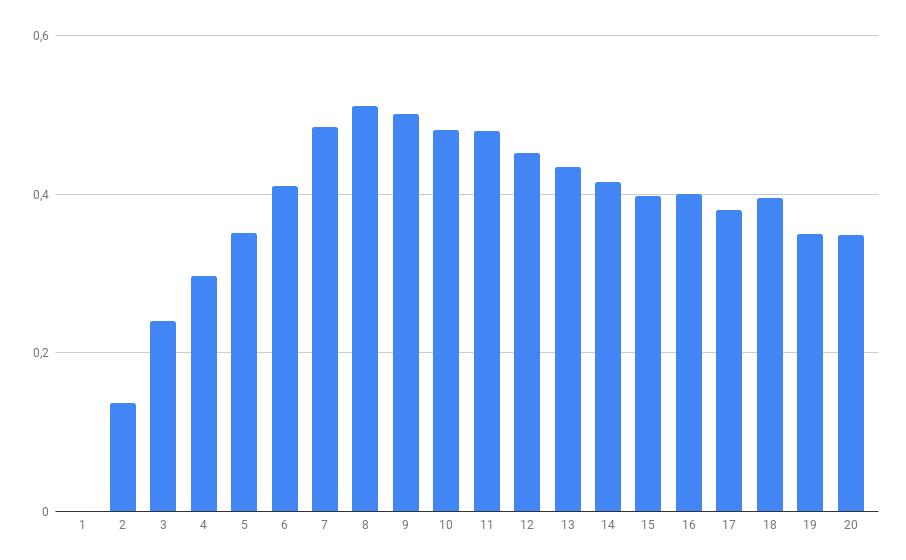
The highest score is achieved in 8 categories, the same number as the one we got using the elbow method.
Conclusion
Choosing the correct and optimal number of categories is a very frequent problem in unsupervised machine learning and data clustering. Sometimes you can make a fairly good assumption by just looking at your data and studying its domain. But if you want to adjust this number to be more precise or find order in chaotic data it’s good to test different metrics and see what insights about your data they provide. In this post, I have tried only two methods for one problem, but there are many more. Don’t be afraid to try something new!
Links
Scripts and dataset from this post: https://github.com/smyachenkov/clustering_categories_number_demo
Elbow method description: https://wikipedia.org/wiki/Elbow_method_(clustering)
Silhouette method description: https://wikipedia.org/wiki/Silhouette_(clustering))
Problem of choosing number of clusters in a dataset: https://wikipedia.org/wiki/Determining_the_number_of_clusters_in_a_data_set
K-Means implementation in scikit-learn library: https://scikit-learn.org/stable/modules/generated/sklearn.cluster.KMeans.html
Silhouette metric implementation in scikit-learn library: https://scikit-learn.org/stable/modules/generated/sklearn.metrics.silhouette_score.html